When we take samples from a population and calculate their means, the means are organized into a distribution around the real population mean. The standard error is the standard deviation of this distribution of sampling means. The standard error measures how closely a sample’s mean corresponds to the population’s true mean. With a bigger standard error, the means are more spread out, and your sample mean is more likely to be an inaccurate reflection of the underlying population mean. A smaller standard error, on the other hand, implies that the means are closer together, and thus your sample mean is more likely to be an accurate depiction of the underlying population mean.
Meaning of Standard Error of the Mean and Standard Deviation
The standard deviation (SD) of a dataset is a measure of its dispersion to its mean. The standard error of the mean (SEM) is a measurement of how far a sample’s mean differs from the population mean. The SD is divided by the square root of the sample size in the SEM.
The standard deviation is divided by the square root of the random sample to produce the standard error of the mean (SEM). The standard error of the mean is calculated by determining the sample-to-sample deviation of the sample means.
The SEM indicates how accurate the sample mean is as an estimate of the population’s true mean. As the sample size grows higher, the SEM reduces compared to the standard deviation; thus, as the sample size expands, the sample mean more accurately estimates the population’s true mean. Increasing the sample size, on the other hand, does not always make the SD larger or smaller; it simply becomes a more accurate assessment of the population SD.
The formula required to determine the standard error of the mean
-
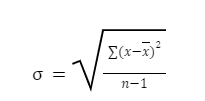
Standard Deviation

Where σ = Lower case sigma is the symbol for standard deviation
Σ = Upper case sigma is the summation symbol
x = Each value in the data set
x̅ = The arithmetic mean (known as “x-bar”)
n = The number of data points in the set (the number of X values)
-
Standard Error (SE)
s/√n
Where S= sample SD
n= number of observations in the sample
-
Standard Error of Mean (SEM)
σM= σ/√n
Where M = sample mean
n= sample size
Therefore, Standard Error of Mean = Ratio of the Standard Deviation to the square root of the sample size.
-
SEM = Standard Deviation/ √samplesize(n)
Steps to determine the Standard Error of the Mean:
-
To get the standard error of the mean, use the formula M =/N. M stands for the standard error of the mean, which is the number you’re looking for,, for the standard deviation of the original distribution, and N for the square of the sample size in this method.
-
Calculate the original distribution’s standard deviation. The standard deviation simply indicates how far the numbers on the number line are apart.
-
If the standard deviation is not given, find the mean of the set of numbers by adding all the numbers together and then dividing that sum by the number of items that are included.
-
Subtract the mean from each of the starting numbers and square the answers.
-
The next step is to calculate the average of this new set of numbers; the result will give the variance.
-
The standard deviation is then calculated by squaring the variance. Here, we will substitute the number for the symbol.
-
Calculate the sample size. The sample size refers to how many objects or observations you have to deal with.
-
Substitute your sample size for N in the formula.
-
Calculate the square root of the sample size.
-
Subtract the square root of the sample size from the standard deviation. The standard error of the mean will be calculated as a result of the answer.
Conditions for determining the standard error of the mean:
-
When calculating the standard error of a mean, the most crucial assumption is that the observations are similarly likely to be acquired and are independent. To put it another way, the sample should have been gathered through random sampling or allocation.
-
Although the standard error of the mean can be calculated for any type of variable, it is most useful for measurement variables (continuous or discrete) and binary variables.
-
It can be calculated for any form of frequency distribution, however, like the standard deviation, it is expected to be distributed symmetrically for most of the tasks it is used for.
-
The standard error of the mean is frequently used in scientific data reporting. It’s a good estimate for the variability of our mean estimate, but not for the variability of the data.
-
It can also be used as an indirect measure of the dependability of our estimate of the mean if the sample size is large enough and it is a random sample from the population.
Conclusion
All forms of statistical research, including those in accounting, medicine, science, technology, and psychiatry, use standard deviation and standard error. The SD and estimated SEM are used in this research to illustrate sample data characteristics and explain statistical analysis results. The SD and the SEM are sometimes confused by researchers. Such researchers should keep in mind that the SD and SEM estimates involve a variety of statistical judgments, each with its meaning. SD stands for the standard deviation of individual data values. Standard Deviation evaluates how well the mean resembles the sample data. Statistical inference based on the sampling distribution is included in the meaning of the standard error of the mean. The SEM is the standard deviation of the sample mean theoretical distribution.