Random variables depend on the value of any unexpected event yet to occur. Therefore, the random variable’s values are related to the results of the random experiment.
-
Discrete Random Variable
-
Continuous Random Variable
The probability distribution is a mathematical formula that describes how likely it is for a random variable to fall within a range of particular values, rather than an exact value. This function can be used to determine the behaviour of continuous probability systems. Now, let us see how random variables and probability distributions are connected.
Probability density function
Generally, the Probability Function refers to the concentration of the continuous random variables falling within a range of specified values.
Probability mass function definition
The probability mass function, or PMF, describes the probability for a particular random variable. We can also say that it results in a probability related to a particular value. This probability always ranges from 0 to 1.
Continuous function
When we take the case of a continuous random variable, it is known as the probability density function. The representation is the same as f(x).
Random variable
The value of a random variable is denoted by E(x). The value is calculated using the probability mass function when the value of the random variable is discrete and using the probability density function when the value of the random variable is continuous. The formulas used to calculate the values of discrete and continuous probabilities are:
-
E(x) = Σxf(x)
-
E(x) = ∫xf(x)dx
The variance of random variables
The variance of a random variable is the mean of all the values of the random variable denoted by Var(x). The weights of these values can be given by the probability mass function in the case of discrete value and by the probability mass function in the case of the continuous value of a random variable. The formula to calculate the variance is:
-
Var(x) = σ2 = Σ(x − μ)2f(x)
How are random variables and probability distributions connected?
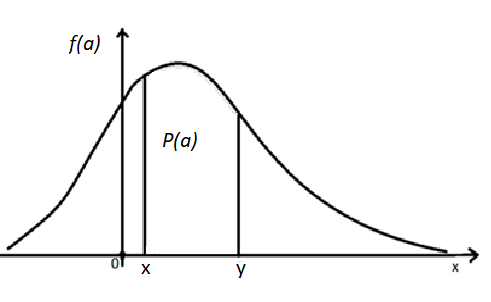
Generally, the probability distribution refers to the concentration of continuous random variables falling within a range of specified values. Therefore, the probability distribution provides a probability of values for continuous random variables. To calculate the probability distribution of a continuous random variable that takes values between certain limits, say x and y, the area under the curve and the x-axis must be calculated within the lower limit (x) and upper limit (y). Thus, the Probability Density Function (PDF) is given by
P(a) = xyf(a) da 
The Probability Distributions are –
Discrete Uniform Distribution (U)
When all possible outcomes have the same probability, it is called a uniform distribution. A discrete random variable (X) having a uniform distribution between a and b can be expressed as X ~ U (a, b).
Binomial distribution (B)
A binomial distribution is computing the number of successes in an independent trial, each having a binary outcome. The expression is X ~ B (n, p). A binomial trial can have two outcomes, such as win/loss, head/tail, pass/fail, etc.
The probability of success is p, and the probability of failure is q = 1-p. Success is 1, and failure is 0.
Bernoulli distribution (Bern)
A Bernoulli distribution can be viewed as a one time trial of a binomial experiment. It is expressed as X ~ Bern (p).
X ~ Bern (p) —-> X ~ B (1, p)
The mean and variance are:
Mean = p
Variance = p (1-p) = p q
Poisson distribution (Po)
Poisson distributions are discrete probabilistic distribution functions that show probabilities of events occurring within a fixed time interval.
It is expressed as X ~ Po (λ). The mean and variance are:
Mean = Variance = λ
Normal or Gaussian distribution (N)
Normal distribution describes the probability distribution of continuous random variables with real values. The mean and variance are:
Mean = μ
Variance = σ2
Standard Normal Distribution (SND)
It is expressed as Z ~ N (0, 1).
The mean and standard deviation are:
Mean = 0
Standard Deviation = 1
The standardisation formula is Z = (X-μ)/σ
Importance
It is possible to use probability distribution functions in several ways. During experimentation, it can describe random variables, determine the statistical significance of estimated parameter values, predict the probability of a given outcome, and calculate the chances of an outcome falling within a given range.
Statistics revolves around probability distributions. This concept is used in both theoretical and practical ways.
Applications
Various fields of study use probability functions, including statistics, research, engineering and science. Listed below are some significant applications of probability functions:
-
For calculating a random variable’s probabilities.
-
In modelling the temporal distribution of atmospheric NOx concentrations.
-
Modelling of combustion in diesel engines.
-
Calculating a confidence interval for a parameter and the critical region for a hypothesis.
-
Determining an appropriate distributional model for univariate data.
A distributional assumption is often used to create statistical intervals and hypothesis tests. The assumption we are making for the given data set must be justified before we can compute an interval or a test based on it. The distribution used does not need to be the closest fit for the data. However, it should be adequate to allow valid conclusions to be drawn from the statistical analysis.
Conclusion
This article discussed how random variables and probability distributions are connected and calculated. We learned how to solve probability distribution with random variables. We listed the types of probability distribution used to calculate both discrete and continuous random variables.