Dissipation of energy involves how energy is wasted in a reaction or transformation. A form of energy that is not transferred or converted to useful energy is considered wasted because it is lost and dissipated to the surroundings. As we know, no system is perfect. When a system changes, energy is dissipated. This dissipated energy is the energy that could not be used in the process.
Dissipation
When work is done on an object, it experiences certain changes; meanwhile, during the work process, some amount of energy is produced, most of this energy is transferred.
However, a certain amount of energy is released into the surrounding. This energy that isn’t of any use is called wasted or dissipated energy, and this process is called dissipation. According to the law of ‘Energy Conservation’, energy in a process cannot be created or destroyed; it only gets transferred or converted.
Energy Conservation
Energy in Nature is transformed, converted or even dissipated, but it can neither be created nor destroyed. Energy can only be converted from one form to another.
Dissipation of Energy
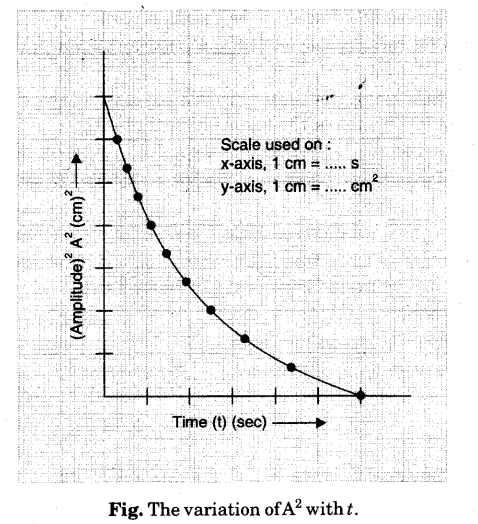
Energy is dissipated during almost all physical and chemical transformations. Dissipation energy can be calculated by plotting a graph between the square of the amplitude and the time.
To study and determine energy dissipation by plotting a graph, the following things are required: a pendulum bob, a chalk piece, a stopwatch, a cork, a long thread, a regular metre scale and a stand (clamp).
Principle
The principle for the experiment states that the energy cannot be destroyed or created but only transformed, converted or dissipated. Therefore, in any isolated mechanical system with practically negligible energy dissipation, the sum of the kinetic and potential energies produced during the process will overcome viscous drag, air resistance or friction (as in the case of a pendulum) and remain constant.
The pendulum experiences a simple harmonic motion (SHM) with an insignificant or negligible energy loss for a small angular amplitude. Therefore, a simple oscillating pendulum helps investigate and validate the law of energy conservation for a mechanical system.
Procedure
-
Measure the mass of the pendulum bob.
-
With the help of a cotton thread, tie the bob. Pass the other end of the thread through the split cork. Maintain the functional length (radius of the bob + length of the hook + length of the thread) of the pendulum at 130 cm. Between the clamps, put two tight cork pieces.
-
Carefully place the stand. The bob should be about 1 to 2 cm above the ground.
-
Keep the bob almost 1-2 cm above the ground.
-
Just below the bob, put a metre scale so that the full-scale division lies below the centre of the bob.
-
Place the bob 5 cm away from the mean position and then release. The bob, at this point, will start vibrating about the mean position. And its amplitude decreases as time passes.
-
Focusing on a stopwatch, transfer the bob to its mean position. And observe the least count of the stopwatch.
-
Adjust the bob along the scale, 5 cm away from the rest position, and release it so that it vibrates in the same vertical plane.
-
When the bob reaches its extreme right position, then start the stopwatch. Also, observe the bob’s position at the metre scale and record this time as zero.
-
Carefully keep focusing on the movement of the bob continuously and observe the amplitude of the bob and simultaneously record the time, after every alternate oscillation, i.e., 0,2,4, 6,………. oscillations till the amplitude decreases to about 1 cm.
-
Take at least ten recordings and plot a graph between amplitude squares.
Observations
Mass of the bob, by physical balance = …. g =….x 10-3kg.
The stopwatch reading = ….. s.
The effective length of the pendulum, l = ….cm ….. m.
Force constant = k = mgl = …Nm-1
|
S.No |
Amplitude A |
A2 |
Time t (sec) |
E=1/2kA2 E0= (joule) |
Energy dissipation E=(E0-E) joul |
||
|
(cm) |
(m) |
(cm2) |
(m2) |
||||
|
1 |
|||||||
|
2 |
|||||||
|
3 |
|||||||
|
4 |
|||||||
|
5 |
|||||||
|
6 |
|||||||
Calculation
Energy (E) of a simple pendulum is directly proportional to the square of the amplitude,
A2 ( E = 12kA02 )

Conclusion
Dissipation of energy by plotting a graph between the square of amplitude and time is a method to observe the dissipation of energy in a mechanical setting. The law of energy conservation says that energy in any chemical, physical or mechanical work does not get created or destroyed; the energy is only converted, transferred or dissipated in the surroundings. We plot the graph to understand the relationship between amplitude and time.